> ## Documentation Index
> Fetch the complete documentation index at: https://docs.vatel.ai/llms.txt
> Use this file to discover all available pages before exploring further.
# Call Analytics
> Call history, transcription, recording, extracted variables and much more.
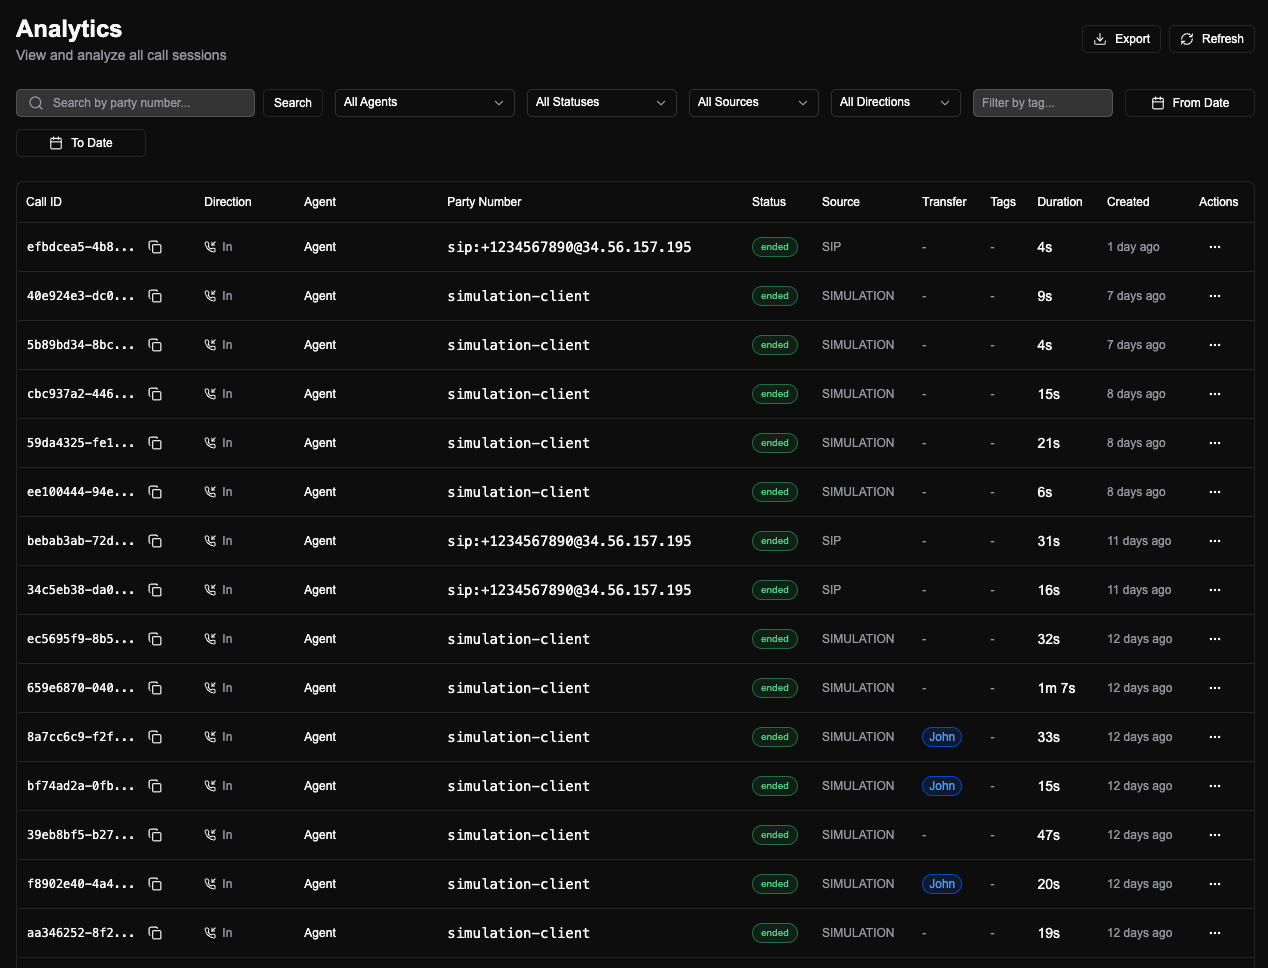
The **Call Analytics** tab shows every call an agent has handled. Open a row to see what happened: how it behaved, what it decided, and what it used.
 ## Basic information
Each call shows date and time, duration, and a copyable call ID. You can **download** the recording or **share** the call with someone else in the org.
The call ID is what you use when you need to reference a specific call (e.g. in support tickets or when talking to your provider). Sharing sends a link so the other person can open the same analysis without digging through the list.
## Path (timeline)
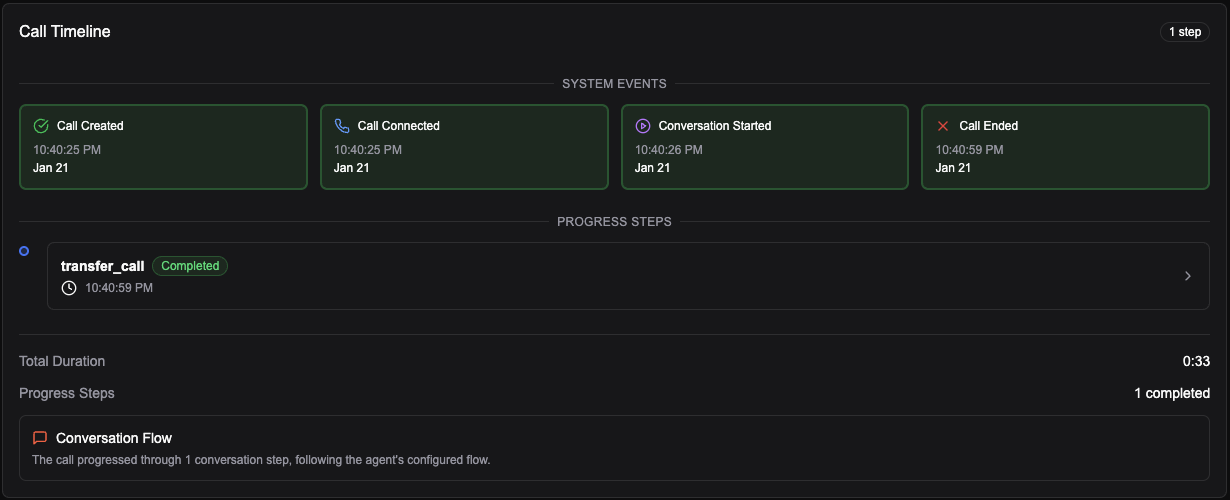
The **path** is the sequence of nodes the agent hit during the call. Handy for seeing where it went and where to improve.
If a call didn’t end where you expected, the path shows exactly where it branched. That makes it easier to spot missing intents, unclear prompts, or nodes that need a fallback.
## Basic information
Each call shows date and time, duration, and a copyable call ID. You can **download** the recording or **share** the call with someone else in the org.
The call ID is what you use when you need to reference a specific call (e.g. in support tickets or when talking to your provider). Sharing sends a link so the other person can open the same analysis without digging through the list.
## Path (timeline)
The **path** is the sequence of nodes the agent hit during the call. Handy for seeing where it went and where to improve.
If a call didn’t end where you expected, the path shows exactly where it branched. That makes it easier to spot missing intents, unclear prompts, or nodes that need a fallback.
 ## Variables
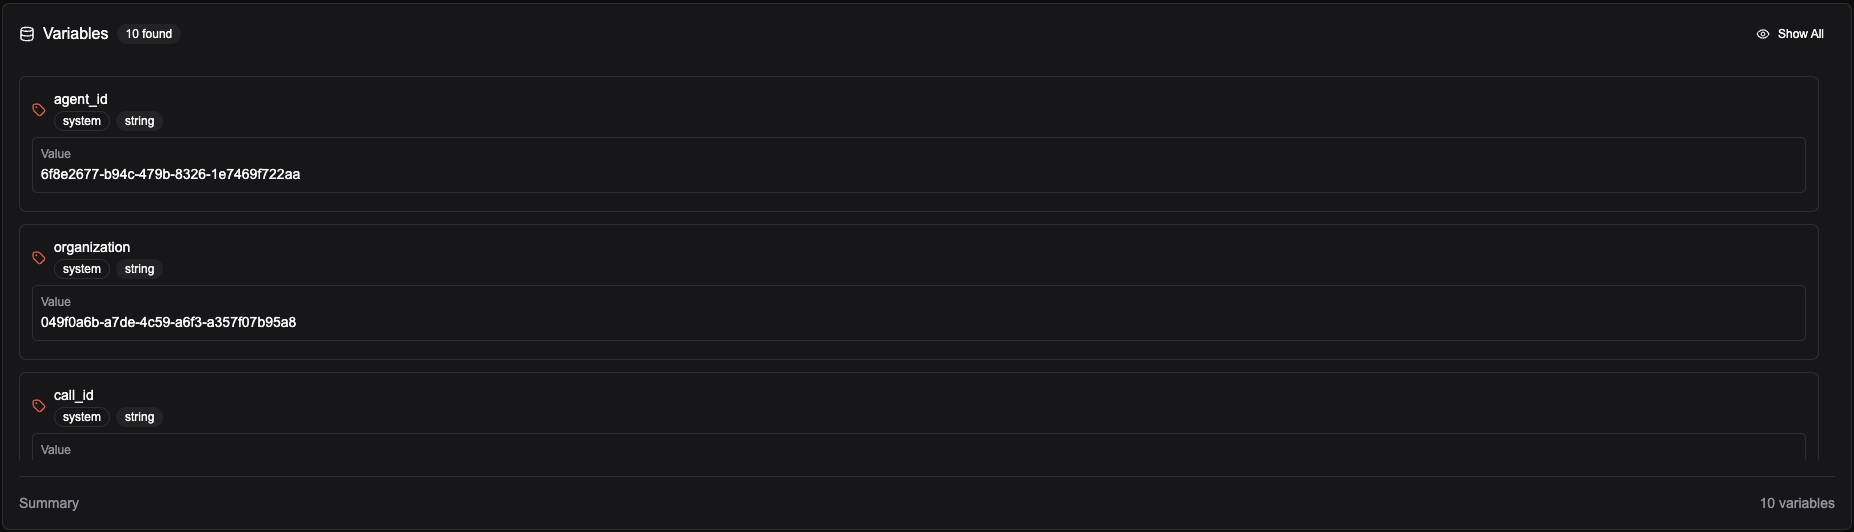
Shows all variables associated with the call such as extracted variables, system variables, and other variables.
## Variables
Shows all variables associated with the call such as extracted variables, system variables, and other variables.
 ## Recording & Transcription
Play the **audio** to check voice quality, clarity, and how the call felt end-to-end. Full **transcript** in sync with the audio. In **Debug mode** you also get **Tool Calls** (API calls, searches, etc.) as they happen.
## Recording & Transcription
Play the **audio** to check voice quality, clarity, and how the call felt end-to-end. Full **transcript** in sync with the audio. In **Debug mode** you also get **Tool Calls** (API calls, searches, etc.) as they happen.